Data Frame Manipulation
Overview
Teaching: 10 min
Exercises: 10 minQuestions
Data-frames. What are they, and how to manage them?
Objectives
Understand what is a data-frame and learn to manipulate it.
Matrix
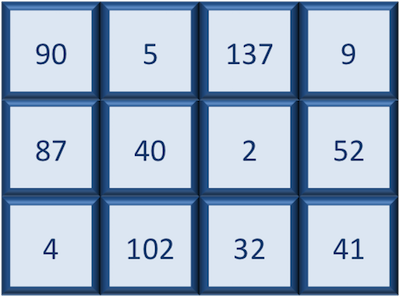
A matrix in R is a collection of vectors of same length and identical datatype. Vectors can be combined as columns in the matrix or by row, to create a 2-dimensional structure.
Matrices are used commonly as part of the mathematical machinery of statistics. They are usually of numeric datatype and used in computational algorithms to serve as a checkpoint. For example, if input data is not of identical data type (numeric, character, etc.), the matrix() function will throw an error and stop any downstream code execution.
Data-frames
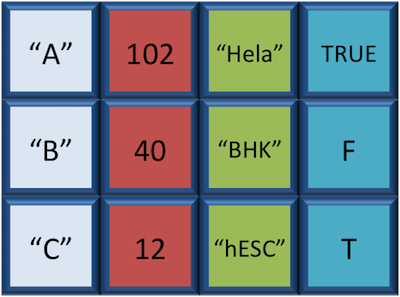
A data.frame is similar to a matrix in that it’s a collection of vectors of the same length and each vector represents a column. However, in a dataframe each vector can be of a different data type (e.g., characters, integers, factors). In the data frame pictured below, the first column is character, the second column is numeric, the third is character, and the fourth is logical.
A data frame is the most common way of storing data in R, and if used systematically makes data analysis easier.
We can create a dataframe by bringing vectors together to form the columns. We do this using the data.frame() function, and giving the function the different vectors we would like to bind together. This function will only work for vectors of the same length.
# Create a data frame and store it as a variable called 'df'
df <- data.frame(object_1, object_2)
As with any variable, we can print the values stored inside to the console if we type the variable’s name and run.
df
Exercise
Create a data frame with
moleculesandweight_g
Data frame example
We can create a more complex data frame using the following syntax:
df <- data.frame(id = c("a", "b", "c"),
                 x = c(1, 2, 3),
                 y = c(TRUE, TRUE, FALSE))
Exercise
Create another data frame called
rnawith the following vectors as columns:
- gene: Asl, Klk6, Tnc
- sample: GS1, GS2, GS1
- expression: 1170, 85, 219
We can see that a new variable called rna has been created in our Environment within a new section called Data. In the Environment, it specifies that rna has 3 observations of 3 variables. What does that mean? In R, rows always come first, so it means that df has 3 rows and 3 columns. We can get additional information if we click on the blue circle with the white triangle in the middle next to rna. It will display information about each of the columns in the data frame, giving information about what the data type is of each of the columns and the first few values of those columns.
Another handy feature in RStudio is that if we hover the cursor over the variable name in the Environment, rna, it will turn into a pointing finger. If you click on rna, it will open the data frame as it’s own tab next to the script editor. We can explore the table interactively within this window. To close, just click on the X on the tab.
You have just created your first data frame. A data-frame is a collection of vectors (i.e. a list) whose components must be of the same data type within each vector. To view the data frame use the following:
View(rna)
We can pull out columns from the new object using the $ operator. In order to use it, you will need to write the name of your data frame followed by the $ operator with the name of the column you want to extract.
rna$gene
Key Points
Data-frames contain multiple columns with different types of data.