First Steps on R
Overview
Teaching: 15 min
Exercises: 10 minQuestions
What is R, and why is important to learn to use it?
What types of data does the R language has?
Objectives
Understand why R is important.
Describe the purpose and use of each panel in the RStudio IDE
Locate buttons and options in the RStudio IDE
Define a variable
Assign data to a variable
It takes courage to sail in uncharted waters -Snoopy
Introduction to R/RStudio
What is R?
“R” is used to name a programming language and the software that reads and interprets the instructions written on the scripts of this language. Is specialized in statistical computing and graphics.
The R environment combines:
- effective handling of big data
- collection of integrated tools
- graphical facilities
- simple and effective programming language
Why use R?
R is a powerful environment. It has a wide range of statistics and general data analysis and visualization capabilities.
Benefits of learning R
- R is interdisciplinary and extensible: There are 10,000+ packages that can be installed to extend its capabilities. R provides a framework that allows you to combine statistical approaches from many scientific disciplines.
- R works on data of all shapes and sizes: The skills you learn with R scale easily with the size of your dataset. Whether your dataset has hundreds or thousands of lines, it won’t make much difference. R is designed for data analysis, and it comes with special data structures and data types that make handling missing data convenient.
- R can connect to spreadsheets, databases, and many other data formats.
- R produces high quality graphics: The plotting functionalities in R are extensive and allow you to adjust any aspect of your graph to convey most effectively the message from your data.
- R is free!: Anyone can use it!
Example of R used in the media
- “At the BBC data team, we have developed an R package and an R cookbook to make the process of creating publication-ready graphics in our in-house style…” - BBC Visual and Data Journalism cookbook for R graphics
What is RStudio?
![]()
RStudio, which is an Integrated Development Environment (IDE) for working with R. First time users often confuse the two. At its simplest, R is like a car’s engine while RStudio is like a car’s dashboard as illustrated in the Figure below.
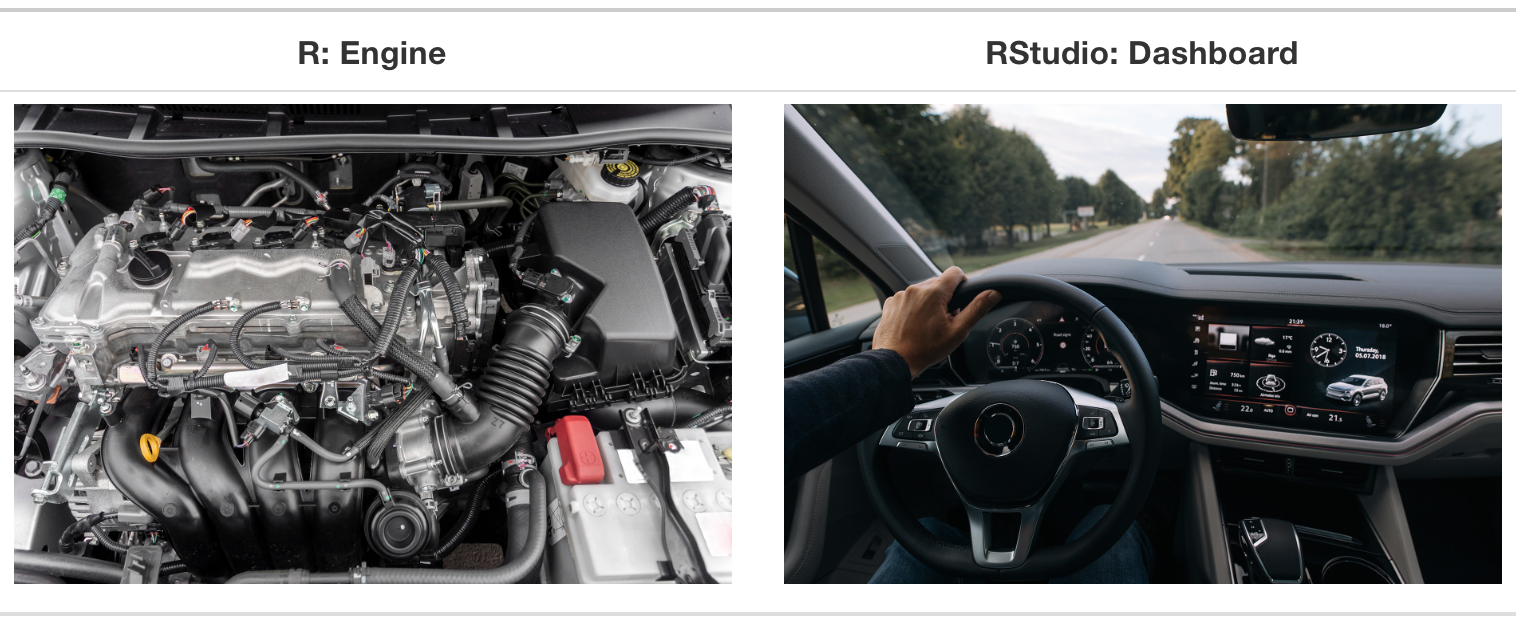
More precisely, R is a programming language that runs computations, while RStudio provides an interface by adding many convenient features and tools.
RStudio Interface
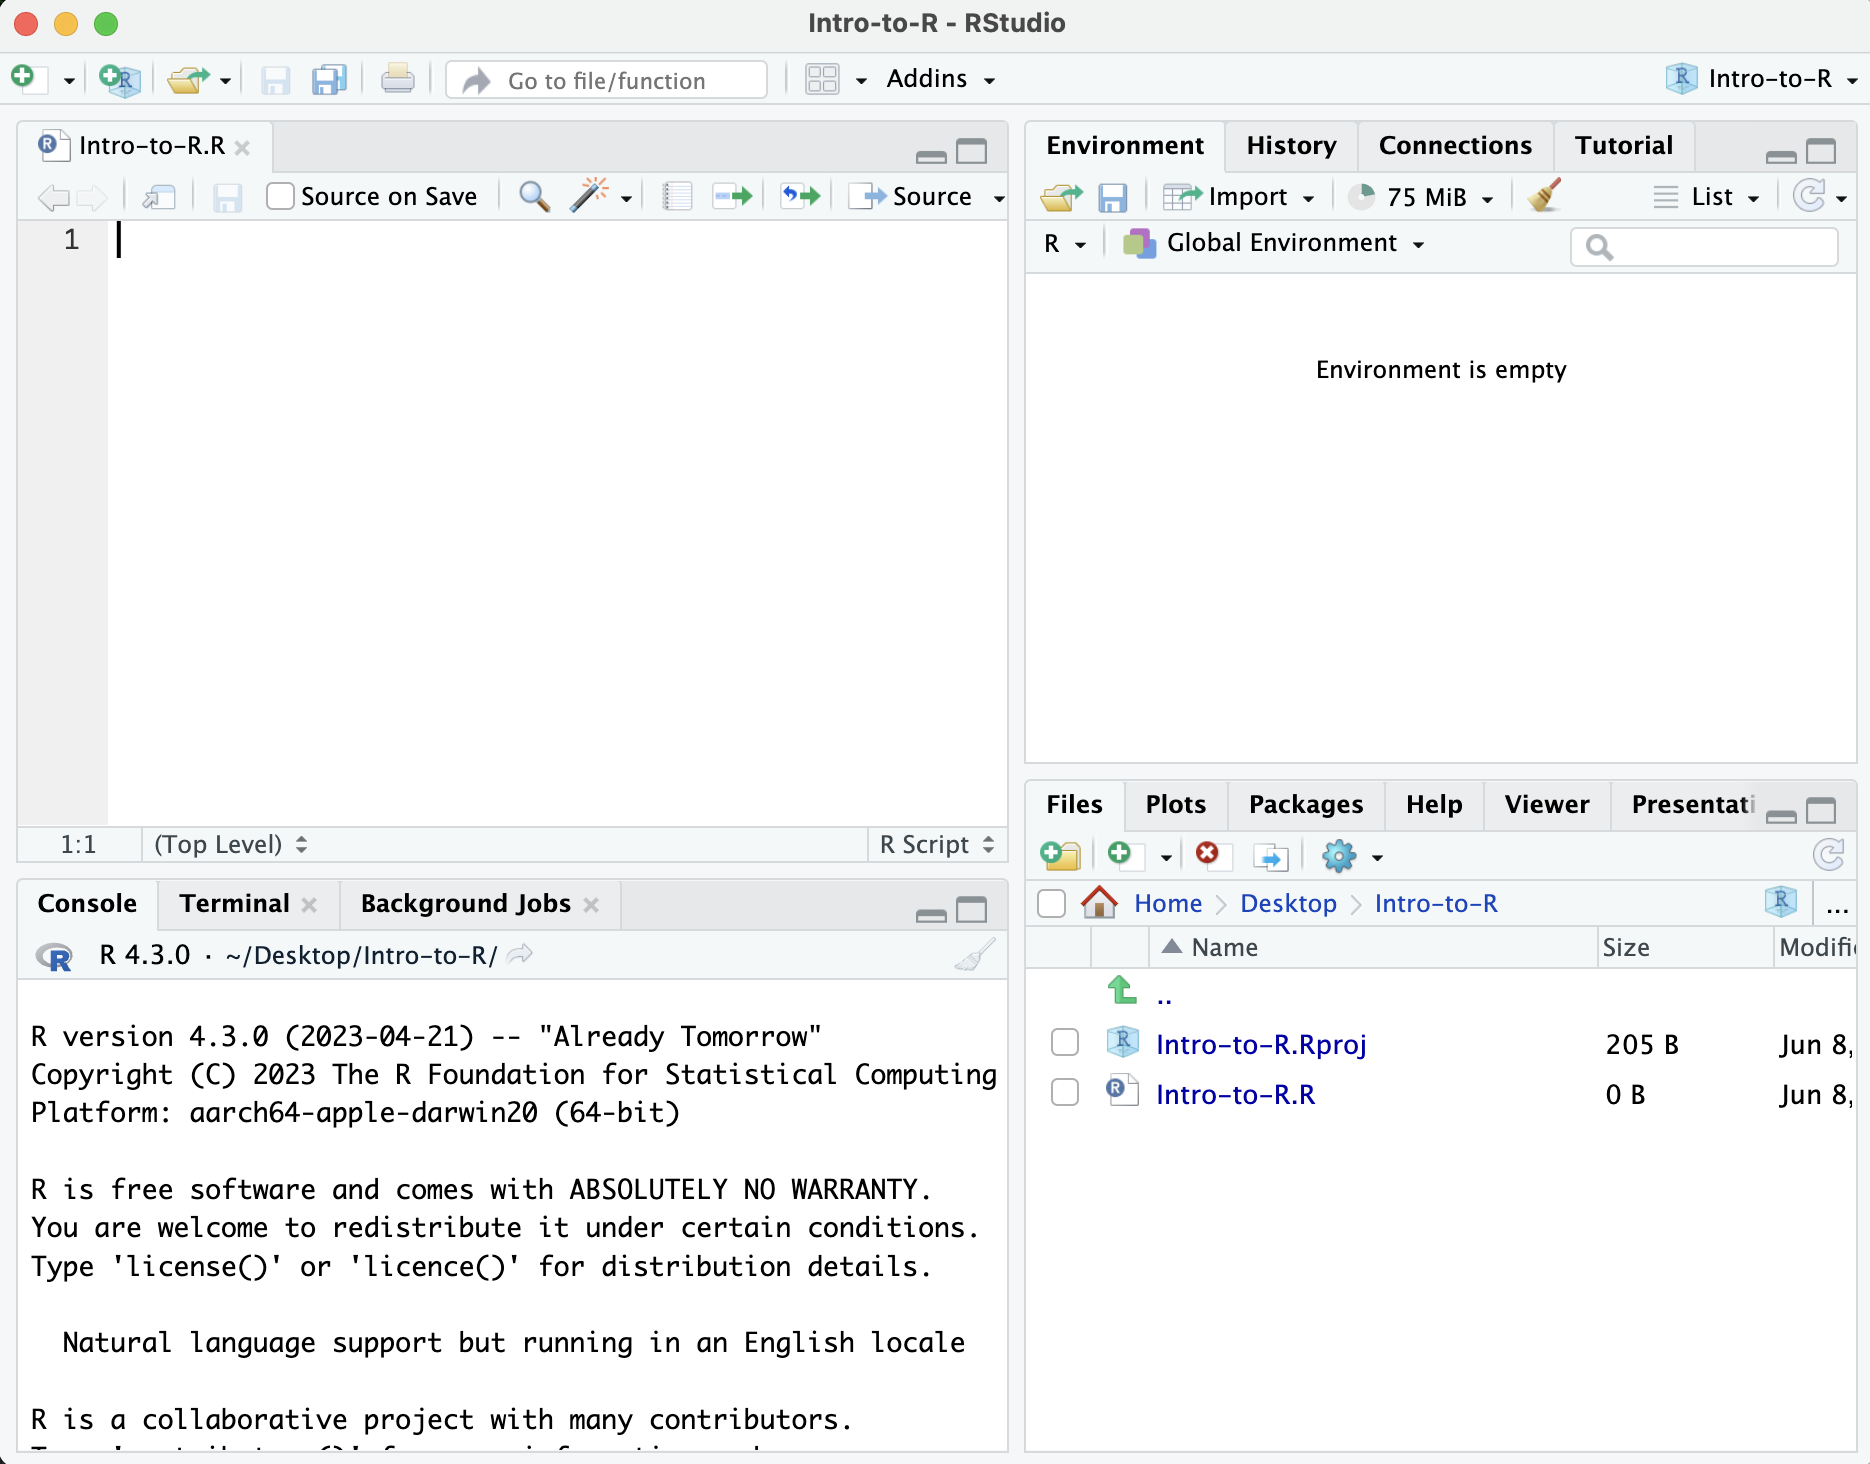
The RStudio interface has four main panels:
- Console: where you can type commands and see output. The console is all you would see if you ran R in the command line without RStudio.
- Script editor: where you can type out commands and save to file. You can also submit the commands to run in the console.
- Environment/History: environment shows all active objects and history keeps track of all commands run in console
- Files/Plots/Packages/Help is a handy browser for your current files, this is where your plots will appear, you can view package information, and much more.
The placement of these panes and their content can be customized (see menu, Tools -> Global Options -> Pane Layout).
Getting Set Up
It is good practice to keep a set of related data, analyses, and text self-contained in a single folder, called the working directory. All of the scripts within this folder can then use relative paths to files that indicate where inside the project a file is located (as opposed to absolute paths, which point to where a file is on a specific computer). Working this way makes it a lot easier to move your project around on your computer and share it with others without worrying about whether or not the underlying scripts will still work.
RStudio provides a helpful set of tools to do this through its “Projects” interface, which not only creates a working directory for you, but also remembers its location (allowing you to quickly navigate to it) and optionally preserves custom settings and open files to make it easier to resume work after a break. Go through the steps for creating an “R Project” for this tutorial below.
Let’s create a new project directory for our “Introduction to R” lesson today.
- Open RStudio
- Go to the
Filemenu and selectNew Project. - In the
New Projectwindow, chooseNew Directory. Then, chooseNew Project. Name your new directoryIntro-to-Rand then “Create the project as subdirectory of:” the root of your VACC home account (~). - Click on
Create Project. - When RStudio opens, you will see three panels in the window. We would like to generate the fourth panel.
- Go to the
Filemenu and selectNew File, and selectR Script. - Go to the
Filemenu and selectSave As..., typeIntro-to-R.Rand selectSave
The RStudio interface should now look like the screenshot below:
Organizing your working directory
Using a consistent folder structure across your projects will help keep things organised, and will also make it easy to find/file things in the future. This can be especially helpful when you have multiple projects. In general, you may create directories (folders) for scripts, data, and documents.
data/Use this folder to store your raw data and intermediate datasets you may create for the need of a particular analysis. For the sake of transparency and provenance, you should always keep a copy of your raw data accessible and do as much of your data cleanup and preprocessing programmatically (i.e., with scripts, rather than manually) as possible. Separating raw data from processed data is also a good idea.documents/This would be a place to keep outlines, drafts, and other text.scripts/(orsrc) This would be the location to keep your R scripts for different analyses or plotting, and potentially a separate folder for your functions (more on that later).
You may want additional directories or subdirectories depending on your project needs, but these should form the backbone of your working directory.

What happens when you create a R Project?
When creating a project in RStudio you associate it with a working directory of your choice (either an existing one, or a new one). A . RProj file is created within that directory and that keeps track of your command history and variables in the environment. The .RProj file can be used to open the project in its current state but at a later date.
When a project is (re) opened within RStudio the following actions are taken:
- A new R session (process) is started
- The .RData file in the project’s main directory is loaded, populating the environment with any objects that were present when the project was closed.
- The .Rhistory file in the project’s main directory is loaded into the RStudio History pane (and used for Console Up/Down arrow command history).
- The current working directory is set to the project directory.
- Previously edited source documents are restored into editor tabs
- Other RStudio settings (e.g. active tabs, splitter positions, etc.) are restored to where they were the last time the project was closed.
Information adapted from RStudio Support Site
The working directory
The working directory is an important concept to understand. It is the place from where R will be looking for and saving the files. When you write code for your project, it should refer to files in relation to the root of your working directory and only need files within this structure.
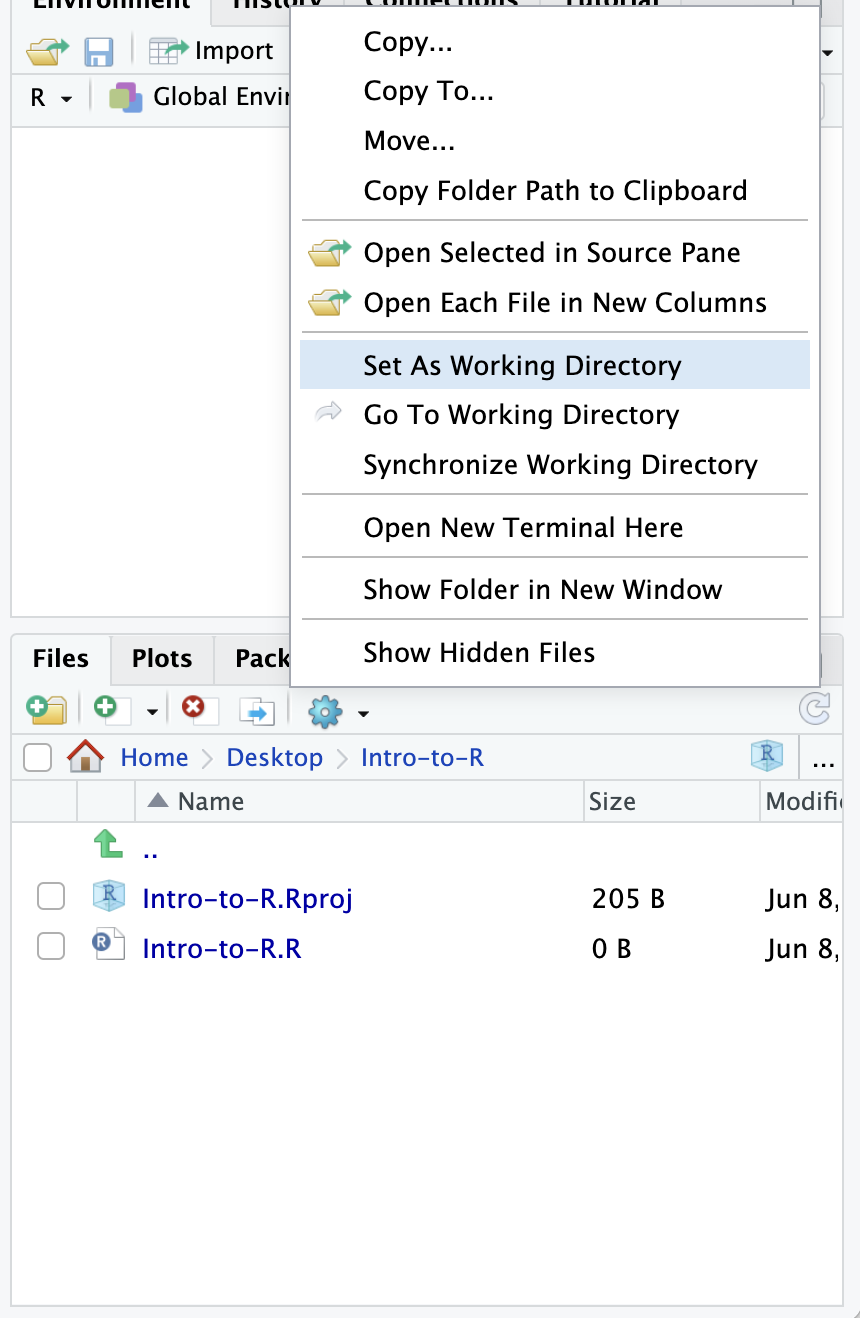
Using RStudio projects makes this easy and ensures that your working directory is set properly. If you need to check it, you can use getwd(). If for some reason your working directory is not what it should be, you can change it in the RStudio interface by navigating in the file browser where your working directory should be, and clicking on the blue gear icon More, and select Set As Working Directory. Alternatively you can use setwd(“/path/to/working/directory”) to reset your working directory. However, your scripts should not include this line because it will fail on someone else’s computer.
Let’s check to see where our current working directory is located by typing into the console:
getwd() # return an abolute filepath
# this is also our first example of a function
Your working directory should be the Intro-to-R folder constructed when you created the project. The working directory is where RStudio will automatically look for any files you bring in and where it will automatically save any files you create, unless otherwise specified.
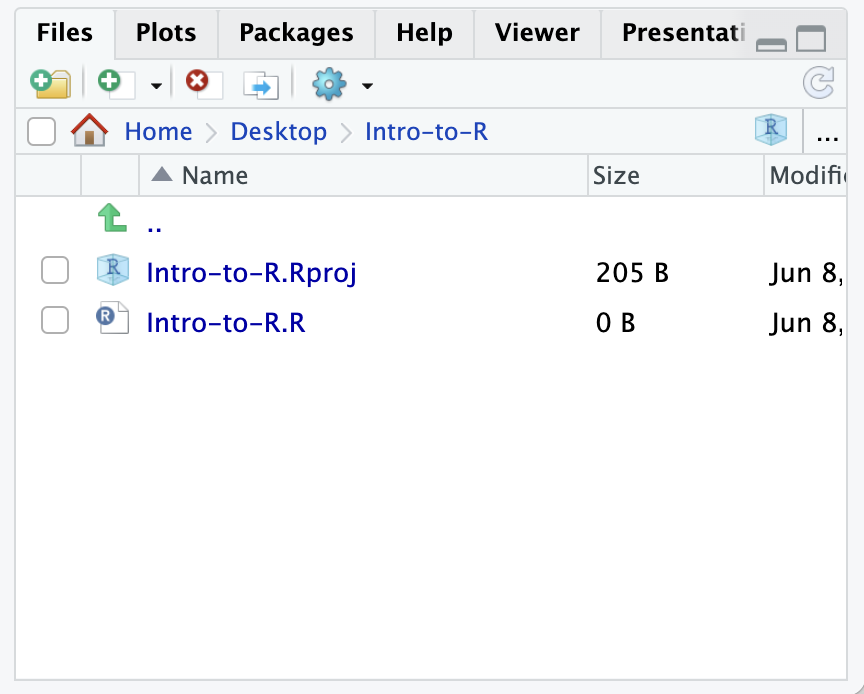
You can visualize your working directory by selecting the Files tab from the Files/Plots/Packages/Help window.
If you wanted to choose a different directory to be your working directory, you could navigate to a different folder in the Files tab, then, click on the More dropdown menu which appears as a Cog and select Set As Working Directory.
Structuring your working directory
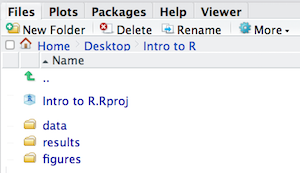
To organize your working directory for a particular analysis, you should separate the original data (raw data) from intermediate datasets. For instance, you may want to create a data/ directory within your working directory that stores the raw data, and have a results/ directory for intermediate datasets and a figures/ directory for the plots you will generate.
Let’s create these three directories within your working directory by clicking on New Folder within the Files tab.
When finished, your working directory should look like:
Soft Wrap Set up
This is more of a housekeeping task. In the future, we may be writing long lines of code in our script editor and want to make sure that the lines “wrap” and you don’t have to scroll back and forth to look at your long line of code.
Click on Code -> Soft Wrap Long lines (make sure this is checked off)
Interacting with R
Now that we have our interface and directory structure set up, let’s start playing with R! There are two main ways of interacting with R in RStudio: using the console or by using script editor (plain text files that contain your code).
Console window
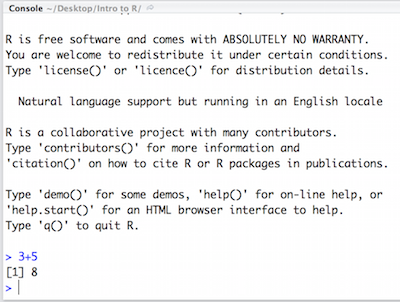
The console window (in RStudio, the bottom left panel) is the place where R is waiting for you to tell it what to do, and where it will show the results of a command. You can type commands directly into the console, but they will be forgotten when you close the session.
Let’s test it out:
3 + 5
Script editor
Best practice is to enter the commands in the script editor, and save the script. You are encouraged to comment liberally to describe the commands you are running using #. This way, you have a complete record of what you did, you can easily show others how you did it and you can do it again later on if needed.
The Rstudio script editor allows you to ‘send’ the current line or the currently highlighted text to the R console by clicking on the Run button in the upper-right hand corner of the script editor.
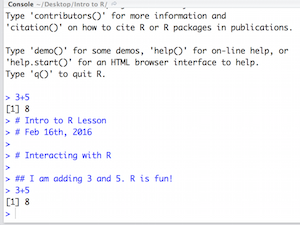
Now let’s try entering commands to the script editor and using the comments character # to add descriptions and highlighting the text to run:
# Intro to R Lesson
# March 19th, 2025

# Interacting with R

## I am adding 3 and 5.
3+5
Alternatively, you can run by simply pressing the Ctrl and Return/Enter keys at the same time as a shortcut.
You should see the command run in the console and output the result.
What happens if we do that same command without the comment symbol #? Re-run the command after removing the # sign in the front:
I am adding 3 and 5. R is fun!
3+5
Now R is trying to run that sentence as a command, and it doesn’t work. We get an error in the console “Error: unexpected symbol in “I am” means that the R interpreter did not know what to do with that command.”
Console command prompt
Interpreting the command prompt can help understand when R is ready to accept commands. Below lists the different states of the command prompt and how you can exit a command:
Console is ready to accept commands: >.
If R is ready to accept commands, the R console shows a > prompt.
When the console receives a command (by directly typing into the console or running from the script editor (Ctrl-Enter), R will try to execute it.
After running, the console will show the results and come back with a new > prompt to wait for new commands.
Console is waiting for you to enter more data: +.
If R is still waiting for you to enter more data because it isn’t complete yet,
the console will show a + prompt. It means that you haven’t finished entering
a complete command. Often this can be due to you having not ‘closed’ a parenthesis or quotation.
Escaping a command and getting a new prompt: esc
If you’re in Rstudio and you can’t figure out why your command isn’t running, you can click inside the console window and press esc to escape the command and bring back a new prompt >.
Keyboard shortcuts in RStudio
In addition to some of the shortcuts described earlier in this lesson, we have listed a few more that can be helpful as you work in RStudio.
| key | action |
|---|---|
| Ctrl+Enter | Run command from script editor in console with Windows or Linux |
| Command+Enter | Run command from script editor in console with MacOS |
| ESC | Escape the current command to return to the command prompt |
| Ctrl+1 | Move cursor from console to script editor |
| Ctrl+2 | Move cursor from script editor to console |
| Tab | Use this key to complete a file path |
| Ctrl+Shift+C | Comment the block of highlighted text |
Exercise
Try highlighting only
3 +from your script editor and running it. Find a way to bring back the command prompt>in the console.
The R syntax
Now that we know how to talk with R via the script editor or the console, we want to use R for something more than adding numbers. To do this, we need to know more about the R syntax.
The main “parts of speech” in R (syntax) include:
- the comments
#and how they are used to document function and its content - variables and functions
- the assignment operator
<-
NOTE: indentation and consistency in spacing is used to improve clarity and legibility
We will go through each of these “parts of speech” in more detail, starting with the assignment operator.
Assignment operator
To do useful and interesting things in R, we need to assign values to
variables using the assignment operator, <-. For example, we can use the assignment operator to assign the value of 3 to x by executing:
x <- 3
The assignment operator (<-) assigns values on the right to variables on the left.
In RStudio, typing Alt + - (push Alt at the same time as the - key, on Mac type option and the - key) and this will write ` <- ` in a single keystroke.
Variables
A variable is a symbolic name for (or reference to) information. Variables in computer programming are analogous to “buckets”, where information can be maintained and referenced. On the outside of the bucket is a name. When referring to the bucket, we use the name of the bucket, not the data stored in the bucket.
In the example above, we created a variable or a ‘bucket’ called x. Inside we put a value, 3.
Let’s create another variable called y and give it a value of 5.
y <- 5
When assigning a value to an variable, R does not print anything to the console. You can force to print the value by using parentheses or by typing the variable name.
y
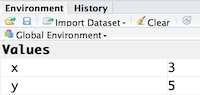
You can also view information on the variable by looking in your Environment window in the upper right-hand corner of the RStudio interface.
Now we can reference these buckets by name to perform mathematical operations on the values contained within. What do you get in the console for the following operation:
x + y
Try assigning the results of this operation to another variable called number.
number <- x + y
Exercises
Try changing the value of the variable
xto 5. What happens tonumber?Now try changing the value of variable
yto contain the value 10. What do you need to do, to update the variablenumber?
Tips on variable names
Variables can be given almost any name, such as x, current_temperature, or subject_id. However, there are some rules / suggestions you should keep in mind:
- Make your names explicit and not too long.
- Avoid names starting with a number (
2xis not valid butx2is) - Avoid names of fundamental functions in R (e.g.,
if,else,for, see here for a complete list). - Avoid dots (
.) within a variable name as inmy.dataset. There are many functions in R with dots in their names for historical reasons, but because dots have a special meaning in R (for methods) and other programming languages, it’s best to avoid them. - Use nouns for object names and verbs for function names
- Keep in mind that R is case sensitive (e.g.,
genome_lengthis different fromGenome_length) - Be consistent with the styling of your code (where you put spaces, how you name variable, etc.). In R, two popular style guides are Hadley Wickham’s style guide and Google’s.
Best practices
Before we move on to more complex concepts and getting familiar with the language, we want to point out a few things about best practices when working with R which will help you stay organized in the long run:
- Code and workflow are more reproducible if you can document everything that we do. Your end goal is not just to “do stuff”, but to do it in a way that anyone can easily and exactly replicate your workflow and results. All code should be written in the script editor and saved to file, rather than working in the console.
- The R console should be mainly used to inspect objects, test a function or get help.
- Use
#signs to comment. Comment liberally in your R scripts. This will help future you and other collaborators know what each line of code (or code block) was meant to do. Anything to the right of a#is ignored by R.
Key Points
R is a programming language
RStudio is a useful tool for script writing and data-management.
A variable can temporarily store data.
R Data Types
Overview
Teaching: 10 min
Exercises: 5 minQuestions
What types of data does the R language have?
Objectives
Learn the types of data that we can manage in R.
Data Types
Variables can contain values of specific types within R. The six data types that R uses include:
"numeric"for any numerical value, including whole numbers and decimals. This is the most common data type for performing mathematical operations."character"for text values, denoted by using quotes (“”) around value. For instance, while 5 is a numeric value, if you were to put quotation marks around it, it would turn into a character value, and you could no longer use it for mathematical operations. Single or double quotes both work, as long as the same type is used at the beginning and end of the character value."integer"for whole numbers (e.g.,2L, theLindicates to R that it’s an integer). It behaves similar to thenumericdata type for most tasks or functions; however, it takes up less storage space than numeric data, so often tools will output integers if the data is known to be comprised of whole numbers. Just know that integers behave similarly to numeric values. If you wanted to create your own, you could do so by providing the whole number, followed by an upper-case L."logical"forTRUEandFALSE(the Boolean data type). Thelogicaldata type can be specified using four values,TRUEin all capital letters,FALSEin all capital letters, a single capitalTor a single capitalF."complex"to represent complex numbers with real and imaginary parts (e.g.,1+4i) and that’s all we’re going to say about them"raw"that we won’t discuss further
The table below provides examples of each of the commonly used data types:
| Data Type | Examples |
|---|---|
| Numeric: | 1, 1.5, 20, pi |
| Character: | “anytext”, “5”, “TRUE” |
| Logical: | TRUE, FALSE, T, F |
The type of data will determine what you can do with it. For example, if you want to perform mathematical operations, then your data type cannot be character or logical. Whereas if you want to search for a word or pattern in your data, then you data should be of the character data type. The task or function being performed on the data will determine what type of data can be used.
Data Structures
Vectors and data types
A vector is the most common and basic data type in R, and is pretty much the workhorse of R. A vector is composed by a series of values, such as numbers

or characters,

or logical values,

We can assign a series of values to a vector using the c() function. For example we can create a vector of animal weights and assign it to a new object weight_g:
# Create a numeric vector and store the vector as a variable called 'weight_g'
weight_g <- c(50, 60, 65, 82)
weight_g
A vector can also contain characters:
molecules <- c("dna", "mrna", "protein", "trna")
molecules
The quotes around “dna”, “rna”, etc. are essential here. Without the quotes R will assume there are objects called dna, rna and protein. As these objects don’t exist in R’s memory, there will be an error message.
There are many functions that allow you to inspect the content of a vector. length() tells you how many elements are in a particular vector:
length(weight_g)
length(molecules)
An important feature of a vector, is that all of the elements are the same type of data. The function class() indicates the class (the type of element) of an object:
class(weight_g)
class(molecules)
The function str() provides an overview of the structure of an object and its elements. It is a useful function when working with large and complex objects:
str(weight_g)
str(molecules)
You can use the c() function to add other elements to your vector:
weight_g <- c(weight_g, 90) # add to the end of the vector
weight_g <- c(30, weight_g) # add to the beginning of the vector
weight_g
In the first line, we take the original vector weight_g, add the value 90 to the end of it, and save the result back into weight_g. Then we add the value 30 to the beginning, again saving the result back into weight_g.
Exercise
What will happen in this example? (hint: use
class()to check the data type of your objects and type in their names to see what happens):num_char <- c(1, 2, 3, "rrna")
Solution
Vectors can be of only one data type. In R, we call converting objects from one class into another class coercion. These conversions happen according to a hierarchy, whereby some types get preferentially coerced into other types. logical → numeric → character ← logical
If you were to try to create the following vector:

R will coerce it into:

Subsetting vectors
If we want to extract one or several values from a vector, we must provide one or several indices in square brackets. For instance:
molecules <- c("dna", "mrna", "protein", "trna")
molecules[2]
molecules[c(3, 2)]
We can also repeat the indices to create an object with more elements than the original one:
more_molecules <- molecules[c(1, 2, 3, 2, 1, 4)]
more_molecules
Finally, it is also possible to get all the elements of a vector except some specified elements using negative indices:
molecules ## all molecules
molecules[-1] ## first one removed
molecules[-c(1, 3)] ## 1st/3rd removed
Key Points
R uses different types of data to store information.
Data Frame Manipulation
Overview
Teaching: 10 min
Exercises: 10 minQuestions
Data-frames. What are they, and how to manage them?
Objectives
Understand what is a data-frame and learn to manipulate it.
Matrix
A matrix in R is a collection of vectors of same length and identical datatype. Vectors can be combined as columns in the matrix or by row, to create a 2-dimensional structure.
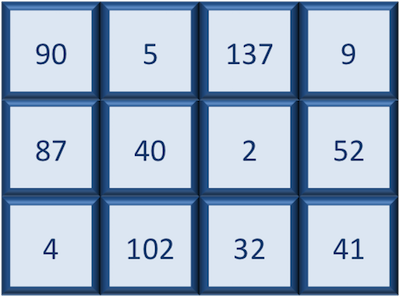
Matrices are used commonly as part of the mathematical machinery of statistics. They are usually of numeric datatype and used in computational algorithms to serve as a checkpoint. For example, if input data is not of identical data type (numeric, character, etc.), the matrix() function will throw an error and stop any downstream code execution.
Data-frames
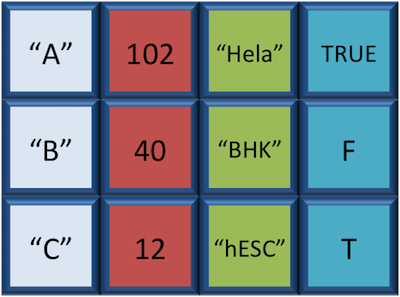
A data.frame is similar to a matrix in that it’s a collection of vectors of the same length and each vector represents a column. However, in a dataframe each vector can be of a different data type (e.g., characters, integers, factors). In the data frame pictured below, the first column is character, the second column is numeric, the third is character, and the fourth is logical.
A data frame is the most common way of storing data in R, and if used systematically makes data analysis easier.
We can create a dataframe by bringing vectors together to form the columns. We do this using the data.frame() function, and giving the function the different vectors we would like to bind together. This function will only work for vectors of the same length.
# Create a data frame and store it as a variable called 'df'
df <- data.frame(object_1, object_2)
As with any variable, we can print the values stored inside to the console if we type the variable’s name and run.
df
Exercise
Create a data frame with
moleculesandweight_g
Data frame example
We can create a more complex data frame using the following syntax:
df <- data.frame(id = c("a", "b", "c"),
                 x = c(1, 2, 3),
                 y = c(TRUE, TRUE, FALSE))
Exercise
Create another data frame called
rnawith the following vectors as columns:
- gene: Asl, Klk6, Tnc
- sample: GS1, GS2, GS1
- expression: 1170, 85, 219
We can see that a new variable called rna has been created in our Environment within a new section called Data. In the Environment, it specifies that rna has 3 observations of 3 variables. What does that mean? In R, rows always come first, so it means that df has 3 rows and 3 columns. We can get additional information if we click on the blue circle with the white triangle in the middle next to rna. It will display information about each of the columns in the data frame, giving information about what the data type is of each of the columns and the first few values of those columns.
Another handy feature in RStudio is that if we hover the cursor over the variable name in the Environment, rna, it will turn into a pointing finger. If you click on rna, it will open the data frame as it’s own tab next to the script editor. We can explore the table interactively within this window. To close, just click on the X on the tab.
You have just created your first data frame. A data-frame is a collection of vectors (i.e. a list) whose components must be of the same data type within each vector. To view the data frame use the following:
View(rna)
We can pull out columns from the new object using the $ operator. In order to use it, you will need to write the name of your data frame followed by the $ operator with the name of the column you want to extract.
rna$gene
Key Points
Data-frames contain multiple columns with different types of data.
Installing R packages
Overview
Teaching: 15 min
Exercises: 10 minQuestions
How can I install packages in R?
Objectives
Install and use libraries in R.
R packages
R contains tens of thousands of functions, objects, and help pages. But to save memory, R does not load every function, or object, or help page every time you start R. Instead, R loads only a core set known as Base R.
What is Base R?
This is a collection of R functions that gets loaded every time you start R. These functions provide the basics of the language, and you don’t have to load a
Comprehensively, these are called Packages. There are 10,000+ user contributed packages and this is still growing.
You can check what libraries are loaded in your current R session by typing into the console:
sessionInfo() #Print version information about R, the OS and attached or loaded packages

# OR

search() #Gives a list of attached packages
To use additional packages will require installation. Many packages can be installed from the CRAN or Bioconductor repositories.
Helpful tips for package installations
- Package names are case sensitive!
- At any point (especially if you’ve used R/Bioconductor in the past), in the console R may ask you if you want to “update any old packages by asking Update all/some/none? [a/s/n]:”. If you see this, type “a” at the prompt and hit Enter to update any old packages. Updating packages can sometimes take awhile to run. If you are short on time, you can choose “n” and proceed. Without updating, you run the risk of conflicts between your old packages and the ones from your updated R version later down the road.
- If you see a message in your console along the lines of “binary version available but the source version is later”, followed by a question, “Do you want to install from sources the package which needs compilation? y/n”, type n for no, and hit enter.
Package installation from CRAN
CRAN is a repository where the latest downloads of R (and legacy versions) are found in addition to source code for thousands of different user contributed R packages.
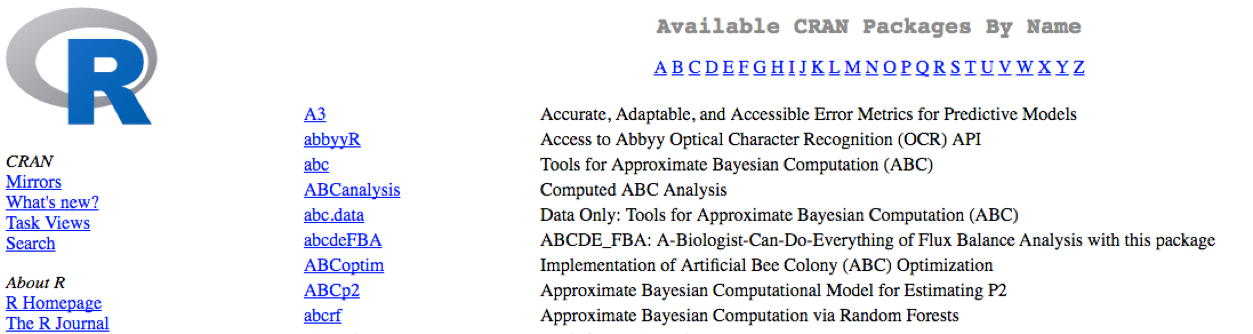
Packages for R can be installed from the CRAN package repository using the install.packages function. This function will download the source code from on the CRAN mirrors and install the package (and any dependencies) locally on your computer.
An example is given below for the ggplot2 package that will be required for some plots we will create later on. Run this code to install ggplot2.
#install.packages("ggplot2")
Package installation from Bioconductor
Alternatively, packages can also be installed from Bioconductor, another repository of packages which provides tools for the analysis and comprehension of high-throughput genomic data. These packages includes (but is not limited to) tools for performing statistical analysis, annotation packages, and accessing public datasets.
![]()
There are many packages that are available in CRAN and Bioconductor, but there are also packages that are specific to one repository. Generally, you can find out this information with a Google search or by trial and error.
To install from Bioconductor, you will first need to install BiocManager. This only needs to be done once ever for your R installation.
Note that in the code below we are using Bioconductor to then install phyloseq using the install() function.
if (!require("BiocManager", quietly = TRUE))
    install.packages("BiocManager")

BiocManager::install("ggplot2")
The code above may not be familiar to you - it is essentially using a new operator, a double colon
::to execute a function from a particular package. This is the syntax:package::function_name().
Loading libraries
Once you have the package installed, you can load the library into your R session for use. Any of the functions that are specific to that package will be available for you to use by simply calling the function as you would for any of the base functions. Note that quotations are not required here.
library(ggplot2)
You can also check what is loaded in your current environment by using sessionInfo() and you should see your package listed as:
other attached packages:
[1] ggplot2_2.0.0
In this case there are several other packages that were also loaded along with ggplot2.
Remember you only need to install a package once in R/RStudio.
However, to use the package, you will need to load the library every time we start a new R/RStudio environment.
You can think of this as installing a bulb versus turning on the light.
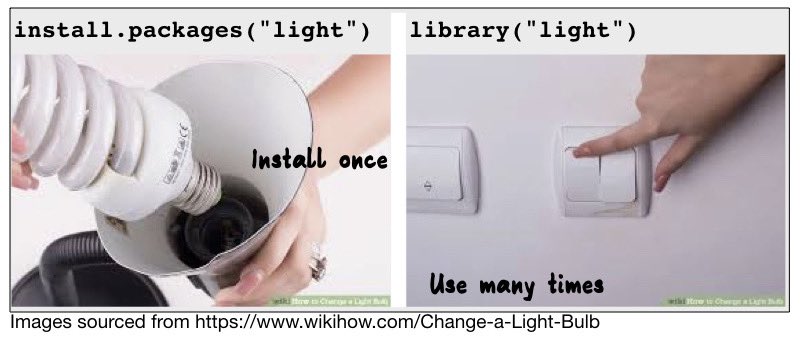
Analogy and image credit to Dianne Cook of Monash University.
Finding functions specific to a package
This is your first time using ggplot2, how do you know where to start and what functions are available to you? One way to do this, is by using the Package tab in RStudio. If you click on the tab, you will see listed all packages that you have installed. For those libraries that you have loaded, you will see a blue checkmark in the box next to it. Scroll down to ggplot2 in your list:
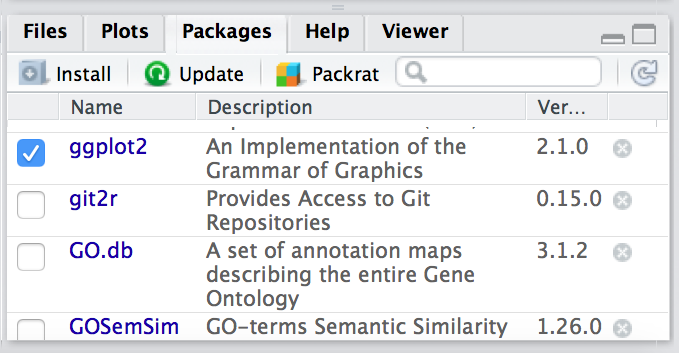
If your library is successfully loaded you will see the box checked, as in the screenshot above. Now, if you click on ggplot2 RStudio will open up the help pages and you can scroll through.
An alternative is to find the help manual online, which can be less technical and sometimes easier to follow. For example, this website is much more comprehensive for ggplot2 and is the result of a Google search. Many of the Bioconductor packages also have very helpful vignettes that include comprehensive tutorials with mock data that you can work with.
If you can’t find what you are looking for, you can use the rdocumention.org website that search through the help files across all packages available.
Key Points
The library
ggplot2creates plots that help/remarks the data analysis.Libraries in R allow us to have sets of functions specialized in a global purpose.
Finding Help on R
Overview
Teaching: 5 min
Exercises: 0 minQuestions
How can I ask R for help?
Objectives
Use the help command to get more insight on R functions.
Seeking help
Use the built-in RStudio help interface to search for more information on R functions
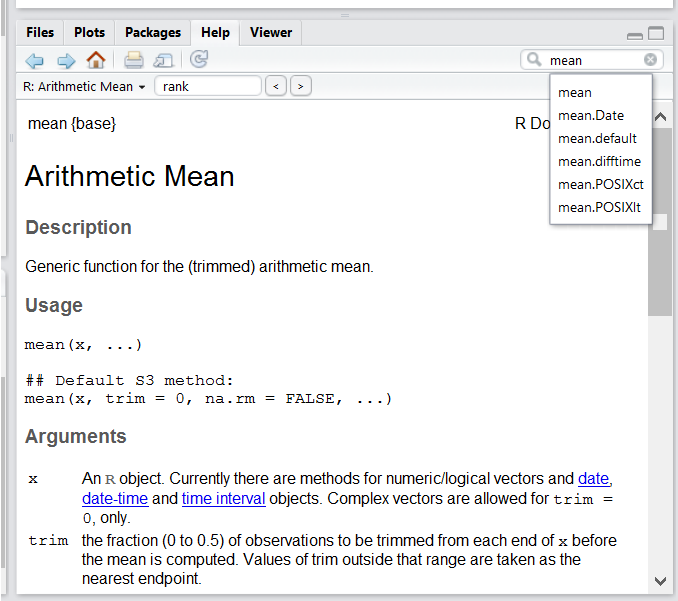
One of the fastest ways to get help, is to use the RStudio help interface. This panel by default can be found at the lower right hand panel of RStudio. As seen in the screenshot, by typing the word “Mean”, RStudio tries to also give a number of suggestions that you might be interested in. The description is then shown in the display window.
I know the name of the function I want to use, but I’m not sure how to use it
If you need help with a specific function, let’s say barplot(), you can type:
?barplot
If you just need to remind yourself of the names of the arguments, you can use:
args(lm)
I want to use a function that does X, there must be a function for it but I don’t know which one…
If you are looking for a function to do a particular task, you can use the
help.search() function, which is called by the double question mark ??.
However, this only looks through the installed packages for help pages with a
match to your search request
??kruskal
If you can’t find what you are looking for, you can use the rdocumentation.org website that searches through the help files across all packages available.
Finally, a generic Google or internet search “R <task>” will often either send you to the appropriate package documentation or a helpful forum where someone else has already asked your question.
I am stuck… I get an error message that I don’t understand
Start by googling the error message. However, this doesn’t always work very well because often, package developers rely on the error catching provided by R. You end up with general error messages that might not be very helpful to diagnose a problem (e.g. “subscript out of bounds”). If the message is very generic, you might also include the name of the function or package you’re using in your query.
However, you should check Stack Overflow. Search using the [r] tag. Most
questions have already been answered, but the challenge is to use the right
words in the search to find the
answers:
http://stackoverflow.com/questions/tagged/r
The Introduction to R can also be dense for people with little programming experience but it is a good place to understand the underpinnings of the R language.
The R FAQ is dense and technical but it is full of useful information.
Asking for help
The key to receiving help from someone is for them to rapidly grasp your problem. You should make it as easy as possible to pinpoint where the issue might be.
Try to use the correct words to describe your problem. For instance, a package is not the same thing as a library. Most people will understand what you meant, but others have really strong feelings about the difference in meaning. The key point is that it can make things confusing for people trying to help you. Be as precise as possible when describing your problem.
If possible, try to reduce what doesn’t work to a simple reproducible example. If you can reproduce the problem using a very small data frame instead of your 50000 rows and 10000 columns one, provide the small one with the description of your problem. When appropriate, try to generalize what you are doing so even people who are not in your field can understand the question. For instance instead of using a subset of your real dataset, create a small (3 columns, 5 rows) generic one. For more information on how to write a reproducible example see this article by Hadley Wickham.
To share an object with someone else, if it’s relatively small, you
can use the function dput(). It will output R code that can be used
to recreate the exact same object as the one in memory:
## iris is an example data frame that comes with R and head() is a
## function that returns the first part of the data frame
dput(head(iris))
If the object is larger, provide either the raw file (i.e., your CSV file) with your script up to the point of the error (and after removing everything that is not relevant to your issue). Alternatively, in particular if your question is not related to a data frame, you can save any R object to a file[^export]:
saveRDS(iris, file="/tmp/iris.rds")
The content of this file is however not human readable and cannot be
posted directly on Stack Overflow. Instead, it can be sent to someone
by email who can read it with the readRDS() command (here it is
assumed that the downloaded file is in a Downloads folder in the
user’s home directory):
some_data <- readRDS(file="~/Downloads/iris.rds")
Last, but certainly not least, always include the output of sessionInfo()
as it provides critical information about your platform, the versions of R and
the packages that you are using, and other information that can be very helpful
to understand your problem.
sessionInfo()
Where to ask for help?
- The person sitting next to you during the course. Don’t hesitate to talk to your neighbor, compare your answers, and ask for help.
- Your friendly colleagues: if you know someone with more experience than you, they might be able and willing to help you.
- Stack Overflow: if your question hasn’t been answered before and is well crafted, chances are you will get an answer in less than 5 min. Remember to follow their guidelines on how to ask a good question.
- The R-help mailing list: it is read by a lot of people (including most of the R core team), a lot of people post to it, but the tone can be pretty dry, and it is not always very welcoming to new users. If your question is valid, you are likely to get an answer very fast but don’t expect that it will come with smiley faces. Also, here more than anywhere else, be sure to use correct vocabulary (otherwise you might get an answer pointing to the misuse of your words rather than answering your question). You will also have more success if your question is about a base function rather than a specific package.
- If your question is about a specific package, see if there is a
mailing list for it. Usually it’s included in the DESCRIPTION file
of the package that can be accessed using
packageDescription("name-of-package"). You may also want to try to email the author of the package directly, or open an issue on the code repository (e.g., GitHub).
More resources
-
The Posting Guide for the R mailing lists.
-
How to ask for R help useful guidelines.
-
This blog post by Jon Skeet has quite comprehensive advice on how to ask programming questions.
-
The reprex package is very helpful to create reproducible examples when asking for help. The rOpenSci community call “How to ask questions so they get answered” (Github link and video recording) includes a presentation of the reprex package and of its philosophy.
Key Points
Help
?shows useful information about the functions you inquire.